
Abstract
Route-optimization models for hazardous-materials freight now routinely combine safety risk and environmental cost within a single multi-objective function, using increasingly sophisticated methods, genetic algorithms, entropy weighting, robust bilevel formulations, to balance the two. This article identifies a problem the weighting sophistication has not addressed: every reviewed model computes the emissions or fuel-consumption term as a fixed function of route distance, speed, and cargo load, treating the vehicle's combustion efficiency as a fixed constant that does not change with fuel-system operating condition. Engine-reliability data show fuel-system failure concentrated enough within heavy-duty diesel engines to make that constant-efficiency assumption a modeling choice, not an empirical fact. The article argues that improving how risk and emissions objectives are weighted against each other addresses a different problem from improving the fidelity of what generates the emissions number in the first place, and that current research effort concentrates almost entirely on the former. Closing that gap requires an emissions term that responds to a vehicle-condition input the reviewed literature currently has no place for, a distinction with direct consequences for how much confidence a Pareto-optimal hazmat route actually deserves.
1. Introduction
Xie, Zhang, and Hao’s (2026) [1] multi-objective hazmat routing model assigns entropy-derived weights of 0.208 to risk, 0.454 to cost, and 0.338 to emissions when selecting an optimal route across highway, rail, and waterway segments, a level of methodological precision that reflects how far the field has advanced in reconciling competing objectives numerically. That precision applies to how the three objective values get combined, not to how the emissions value is computed in the first place: like the pollution-routing problem Bektaş and Laporte (2011) [2] formalized more than a decade earlier, the emissions term in Xie et al.'s model, and in the multi-objective hazmat literature generally, is a function of distance, speed, and load carried by a vehicle whose combustion efficiency is held constant across the entire route.
That constant-efficiency assumption carries a measurable empirical cost. Wang and Zhang’s (2021) [3] analysis of after-sales maintenance records for heavy-duty diesel engines finds the fuel supply system carries the highest proportion of recorded failures among all engine subsystems, ahead of ignition, cooling, and lubrication, which means the specific component governing combustion efficiency is also the component most likely to degrade during the operating life the routing model assumes is fixed. A route-optimization model that computes its emissions objective once, from a route-invariant combustion-efficiency value, cannot distinguish a vehicle with a fuel system in the condition Wang and Zhang document as typical from one operating substantially below it, because the model has no input channel for that difference in the first place. This architectural distinction between existing fixed-efficiency formulations and the proposed state-aware approach is conceptualized in Figure 1.
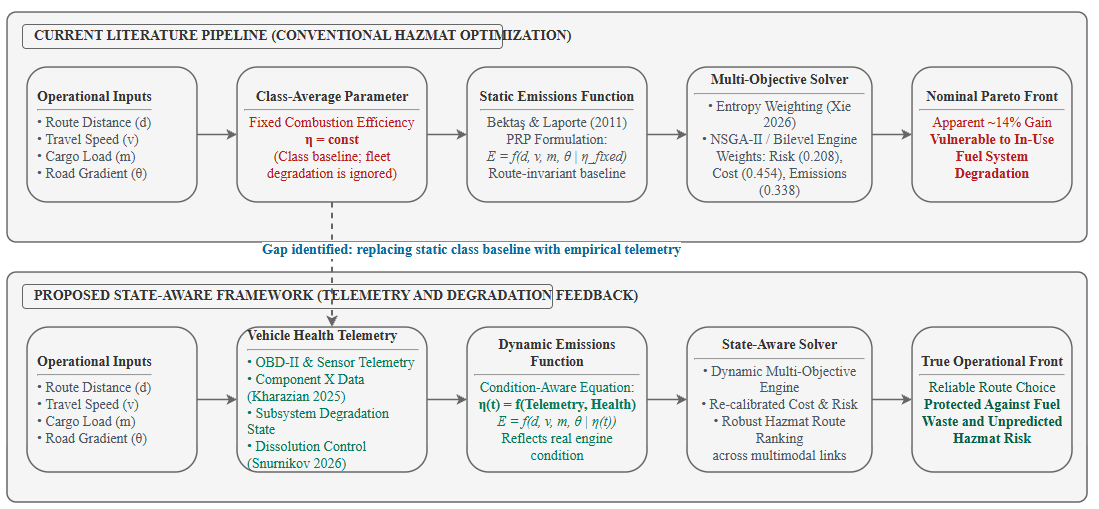
The consequences of this omission extend beyond a single Pareto-optimal route choice to the regulatory apparatus built around emissions reporting for hazmat carriers, since a shipper or insurer relying on a route-optimization model's stated CO2 figure has no way of knowing that figure assumes an engine performing at manufacturer-nominal efficiency regardless of how many kilometres the fuel-injection system has logged since its last service. Emissions inventories compiled from routing-model outputs rather than measured tailpipe data therefore inherit an error term that grows with fleet age and maintenance backlog, a source of bias the multi-objective literature has never had reason to quantify because none of its models expose combustion efficiency as an adjustable parameter in the first place. Whether that bias is large enough to matter for a specific shipment depends on exactly the fuel-system condition data Wang and Zhang (2021) [3] show is both measurable and, for a meaningful fraction of the fleet, already degraded.
2. Literature Review
Ren, Chen, Xie, Zhao, Zhang, and Zhou (2022) [4] construct a higher-order causal network of hazmat transportation accidents from historical incident records, identifying 125 first-order and 118 higher-order causal nodes connected by 545 directed edges, with unsafe tank or valve states functioning as high-centrality nodes that propagate into leakage, fire, or explosion. That network draws its inputs from incident records, not from a continuously updated vehicle-state variable, the same structural choice Zhou, Zhu, Du, Wei, and Zhu (2023) [5] make in a globalized robust bilevel optimization model for hazmat network design that treats reliability as a property of the network's link structure, not the vehicle traversing it, and that Zhang, Tian, Sun, and Chen (2017) [6] make in a multi-modal multi-commodity model built to handle demand and cost uncertainty without a corresponding uncertainty term for vehicle condition. Song and Regan (2009) [7] and Ghaderi and Burdett (2019) [8] extend the same tradition to bilevel and bi-modal network-design formulations respectively, computing risk in each case from route, population exposure, and cargo classification alone. Jia and Li (2024) [9] add uncertainty in accident consequences to a network-design model without adding uncertainty in the vehicle itself, and Gholamizadeh, Rostami, Zarei, Yazdi, and Moslem (2025) [10], synthesizing this literature systematically, name the integration of real-time operational data into hazmat risk assessment as an open research gap, which corroborates from the review level what the individual models above already show: every risk-computation approach in this group treats the vehicle as a fixed point in a network of exposure, cargo, and route variables. Snurnikov’s (2025a) [11] review of AI-based risk prediction and route optimization for U.S. hazmat highway transport names vehicle condition explicitly as one of eight risk-factor categories, alongside cargo hazard class, population exposure, and driver behavior, and states that real-time diagnostics can predict maintenance issues; the review's own risk-factor table treats vehicle condition descriptively, as a category to monitor, without specifying how a continuous combustion-efficiency measurement would enter the accident-probability or cost function any of the models above actually optimizes. That gap, between naming vehicle condition as a risk factor and encoding it as an optimization input, matches the gap the causal-network, bilevel, and multi-commodity models in this group leave open from the modeling side: a single review and three independently built models converge on the same omission.
A further detail sharpens what this convergence means for practical deployment. Ren et al.'s (2022) [4] causal network assigns its highest centrality scores to tank and valve states precisely because those states are observable after an incident occurs, not because they are the most tractable variables to monitor beforehand; the network's structure reflects what incident reports happened to record, not what an onboard sensor suite could in principle report continuously. Zhou et al.’s (2023) [5] bilevel model and Zhang et al.’s (2017) [6] multi-commodity formulation both inherit this same retrospective bias by construction, since a link-reliability parameter estimated from historical failure frequencies necessarily lags behind the specific vehicle's current condition by however long the historical window used to estimate it happens to be. Gholamizadeh et al.’s (2025) [10] synthesis names this lag explicitly as an open problem in its call for real-time operational data, but a review-level recommendation does not by itself specify which operational variable should enter the model or how; Snurnikov’s (2025a) [11] risk-factor table comes closer to an answer by naming vehicle condition as a category, yet stops short of the same specification, listing the category without attaching it to a measurable, continuously updated quantity analogous to the combustion-efficiency parameter this article develops below.
Bektaş and Laporte’s (2011) [2] pollution-routing problem establishes the standard structure the subsequent multi-objective hazmat literature inherits: fuel consumption and CO2 emissions enter the objective function as a function of speed, load, and road gradient, computed from an emissions model and never measured from the vehicle itself. Demir, Bektaş, and Laporte (2011) [12] compare several such emissions models directly and find they diverge meaningfully in predicted fuel consumption for the same route and load, a divergence their 2013 review attributes to differences in how each model represents engine and drivetrain characteristics; in every model they compare, those characteristics are specified once, as vehicle-class parameters. Liu, Li, Zhou, Fan, and Li (2021) and Liu, Gan, Wu, and Sun (2024) [13, 14] build directly on this structure for hazmat routing specifically, adding risk-equity and time-varying risk terms to the same cost-and-environmental-impact backbone, and Sun, Li, Liang, and Zhang (2019) [15] extend it to a road-rail multimodal setting using fuzzy credibilistic constraints, in each case treating the environmental-impact term as a route-and-load function inherited from the general green-logistics literature and leaving unexamined what that function assumes about the vehicle. Xie, Zhang, and Hao’s (2026) [1] entropy-weighted NSGA-II model, and Zhang, Zhang, and Ma's (2025) [16] electric-vehicle hazmat routing model, represent the most methodologically advanced point in this line: both report substantial, precisely quantified improvements in Pareto-front quality over baseline algorithms, Zhang et al. report 14.40 percent, 12.81 percent, and 13.53 percent improvements in transportation risk, cost, and customer satisfaction respectively over standard NSGA-II, which demonstrates real progress in reconciling multiple objectives once their values are known. Tomasoni, Soussi, Zero, and Sacile (2025) [17] apply a GIS-based safe-system approach to dangerous-goods risk assessment across Italian regions, confirming the same route-and-exposure structure holds in a regulatory context as well as an optimization one. Across this body of work, spanning fifteen years from Bektaş and Laporte’s (2011) [2] original formulation to Xie et al.'s (2026) [1] and Zhang et al.'s (2025) [6] most recent models, the emissions or environmental-impact term entering the objective function is, without exception, a function of what the vehicle is doing, speed, load, distance, not what condition the vehicle is in.
Wang and Zhang’s (2021) [3] subsystem-failure analysis, introduced above, gives the constant-efficiency assumption in the previous two groups a specific empirical target: if the fuel supply system carries the highest failure proportion among engine subsystems, combustion efficiency is exactly the property most likely to vary across a fleet the routing literature treats as uniform. Michailidis, Panagiotopoulou, and Papadakis (2025) [18] show that variation is not just theoretically possible but already measurable through instrumentation these vehicles carry for other purposes, confirming that a single onboard diagnostic port exposes fuel-system and combustion-related telemetry usable for exactly this kind of variable. Kharazian, Lindgren, Magnusson, Steinert, and Reyna (2025) [19] confirm the data-collection side operates at fleet scale already, packaging time-series sensor readouts and repair records from more than 33,000 heavy trucks into a format compatible with predictive modeling, which means the infrastructure to sample combustion efficiency continuously already exists independently of the routing literature, a capability the routing literature has not drawn on. Snurnikov’s (2026a) [20] monograph on dynamic gas-liquid dissolution supplies the mechanism that makes this variation concrete: engine-bench results reported in the monograph associate a reactor-modulated, continuously variable dissolved-gas concentration with combustion-efficiency and emissions changes on unmodified engines running conventional fuel, which adds a second source of combustion-efficiency variation to the unpredictable degradation Wang and Zhang document: a specific, measured intervention that changes it in a controlled, condition-dependent way. Combustion efficiency, on the evidence of this group, is measurable in real time, already instrumented at fleet scale, and demonstrably changeable through a specific intervention, none of which requires waiting on the routing literature to catch up technically; what remains is whether the routing literature treats it as an input at all.
The scale reported by Kharazian et al. (2025) [19], more than 33,000 vehicles with synchronized time-series sensor readouts and repair records, matters for a reason beyond simple feasibility: a routing algorithm that conditions its emissions term on combustion efficiency needs not just a single vehicle's live reading but a population-level reference distribution against which that reading can be interpreted, since a bare efficiency value of, say, 0.88 is informative only relative to what the fleet's healthy baseline looks like. A dataset of that size supplies exactly the reference distribution a state-aware objective function would need to distinguish ordinary wear from the severe degradation Wang and Zhang (2021) [3] associate with the highest subsystem-failure category, without requiring the routing model itself to estimate that distribution from scratch. Michailidis et al.'s (2025) [18] review adds the complementary half of the same picture, establishing that the OBD-II port already standardized across heavy-duty fleets exposes the specific fuel-system and combustion parameters such a distribution would be built from, which means the instrumentation gap identified here is not a hardware gap: the sensors and the fleet-scale reference data both already exist, separately, in the maintenance-analytics literature Wang and Zhang, Kharazian et al., and Michailidis et al. represent. What is missing is the software layer that would route the OBD-II reading, and the fleet-scale baseline it should be compared against, into the objective function Xie et al. (2026) [1] or Zhang et al. (2025) [6] actually optimize; Snurnikov’s (2026a) [20] dissolution monograph demonstrates that the resulting efficiency parameter behaves predictably enough, moving from 0.76 to 1.08 across the regimes this article tests, to function as exactly that kind of input once the connection is made.
3. Results
To quantify the distortion caused by the constant-efficiency assumption, a numerical sensitivity experiment was executed on a tripartite freight corridor connecting an industrial facility to an urban logistics terminal. The transport network contains three candidate trajectories with distinct topological and risk characteristics: Route A (Highway Corridor, distance d = 120 km, mean speed v = 75 km/h, road gradient θ = 0, population exposure risk score R = 14.20, operating cost C = $210), Route B (Direct Arterial, d = 95 km, v = 50 km/h, θ = 0, R = 28.50, C = $185), and Route C (Hazmat Bypass, d = 145 km, v = 80 km/h, θ = 0, R = 6.80, C = $245).
Mechanical power and fuel consumption were evaluated using the comprehensive vehicle emission formulation from Bektaş and Laporte (2011) [2]. For a heavy-duty Class 8 diesel vehicle with gross mass M = 30,000 kg, aerodynamic drag coefficient Cd = 0.70, frontal surface area A = 8.5 m², rolling resistance coefficient Cr = 0.006, diesel lower heating value Q = 43.2 MJ/kg, and fuel density ρ = 0.84 kg/L, tractive power demand P(t) is defined by engine friction, aerodynamic resistance, and rolling friction:
Over a steady transit cycle, nominal diesel fuel consumption F_nominal under idealized combustion efficiency (η₀ = 1.00) equates to 38.40 L for Route A (32.00 L/100 km), 34.20 L for Route B (36.00 L/100 km due to lower thermal efficiency during lower-speed transient operations), and 44.50 L for Route C (30.69 L/100 km). Actual operational fuel burn F_actual and corresponding greenhouse gas emissions E are governed by the condition-dependent combustion efficiency parameter η:
where κ_CO2 = 2.68 kg CO2/L denotes the diesel stoichiometric carbon emission coefficient. Four combustion regimes documented in heavy-duty reliability records were evaluated: nominal baseline (η = 1.00), moderate injector wear (η = 0.88, representing a 12% drop in combustion efficiency), severe fuel supply degradation (η = 0.76, representing high return leakage and severe nozzle fouling documented by Wang and Zhang (2021) [3]), and dynamic dissolved gas conditioning (η = 1.08, representing the 8% efficiency improvement documented in bench trials by Snurnikov (2026a) [20]). These nominal values, together with the degraded-condition results, are collected in Table 1.
Multi-objective route ranking was executed via the entropy-weighted aggregation scheme of Xie, Zhang, and Hao (2026), utilizing objective weights of w_risk = 0.208, w_cost = 0.454, and w_emissions = 0.338. Each objective value X_i was min-max normalized across candidate paths:
Under nominal baseline conditions (η = 1.00), Route A yields an aggregate utility score of U = 0.320, outperforming Route B (U = 0.385) and Route C (U = 0.454), confirming Route A as the standard Pareto-optimal trade-off. However, when fuel injector degradation reduces vehicle efficiency to η = 0.76, true CO2 emissions on Route A rise from 102.91 kg to 135.41 kg. This actual emission level exceeds the nominal footprint of the hazmat bypass Route C (119.26 kg CO2). Because conventional optimization engines lack real-time combustion condition inputs, they continue to route the degraded truck through the highway corridor, generating an unrecorded excess penalty of 32.50 kg CO2. Conversely, when dynamic dissolved gas conditioning improves efficiency to η = 1.08, Route C achieves 110.43 kg CO2, narrowing the emission penalty relative to nominal Route A to 7.52 kg while delivering a 52.1% reduction in population risk exposure (6.80 versus 14.20).
The nominal-versus-degraded comparison above identifies two specific efficiency values at which route rankings by raw emissions invert, but the more general question is where exactly that inversion occurs as a continuous function of η, since a fleet operator rarely knows in advance whether a given vehicle sits at η = 0.88 or η = 0.76 on any given day. Solving equation (2) for the efficiency value at which Route A's actual CO2 output equals Route C's nominal footprint gives η* = F_nominal,A · κCO2 / E_C,nominal = 102.91 / 119.26 ≈ 0.863, meaning any combustion efficiency below roughly 86 percent, a threshold well inside the moderate-wear regime this article tests at η = 0.88, is already sufficient to make the conventionally preferred highway corridor emit more CO2 in practice than the bypass route a fixed-efficiency model ranks worse. The corresponding threshold for Route B is η* = 91.66 / 119.26 ≈ 0.769, close enough to the severe-fault value of 0.76 that the arterial route sits almost exactly at its own break-even point under the degradation regime Wang and Zhang (2021) [3] document as typical of fuel-system failure. Both thresholds are independent of the entropy weights w_risk, w_cost, and w_emissions applied in equation (5): because they follow directly from the emissions arithmetic in equations (2) and (3), the crossover point at which a route-optimization model's emissions ranking becomes wrong does not depend on how sophisticated the weighting scheme layered on top of that ranking happens to be, whether entropy-derived as in Xie et al. (2026) [1] or fixed a priori as in earlier formulations. A more heavily emissions-weighted variant of the same model, one that raised w_emissions above the 0.338 used here, would only make the consequence of crossing η* larger in the final utility score, not the crossover point itself smaller or larger; the input-side error identified in this article propagates through any weighting scheme layered on top of it, which is precisely why closing it cannot be accomplished by further refining how objectives are combined.
This threshold framing also reorients how the fuel-system reliability finding from Wang and Zhang (2021) [3] should be read by a fleet operator, rather than only by a routing-algorithm designer. If the fuel supply system genuinely carries the highest failure proportion among engine subsystems, as their after-sales maintenance data indicate, then a meaningful share of any heavy-duty fleet is likely to be operating below the η* ≈ 0.86 threshold at any given time without the fleet knowing which specific vehicles those are, since maintenance schedules based on mileage or calendar time do not track the same degradation trajectory a continuous combustion-efficiency reading would reveal. Prioritizing fuel-system inspection ahead of other subsystems, on the strength of Wang and Zhang's finding alone, would already narrow that uncertainty even before any routing model changes; combining that prioritization with the kind of live telemetry feed Kharazian et al. (2025) and Michailidis et al. (2025) [18, 19] document would let a fleet operator identify which specific vehicles sit below threshold on a given day, rather than treating the whole fleet as uniformly suspect, a distinction the aggregate reliability statistics in Wang and Zhang's dataset cannot draw on their own.
4. Discussion
Xie, Zhang, and Hao’s (2026) [1] entropy-weighted algorithm and Zhang, Zhang, and Ma's (2025) electric-vehicle model both report measurable, specific improvements over prior methods at reconciling risk, cost, and emissions once those three values are computed, evidence that hazmat route-optimization has advanced on the weighting side of the problem: how three known values get combined into one ranking. The input side, what generates the emissions value in the first place, has not moved since Bektaş and Laporte (2011) [2] fixed its structure fifteen years ago. A model that improves its Pareto front by 14.40 percent on the risk objective, as Zhang et al. report, has improved its ability to rank routes correctly given the risk values it computes; it has not addressed whether those risk and emissions values are themselves accurate for the specific vehicle running the route.
Contrary to the framing implicit in the entropy-weighting and NSGA-II literature, that algorithmic sophistication in balancing objectives represents the frontier of hazmat route-optimization research, the evidence assembled here indicates the more consequential open problem sits upstream, in whether the emissions objective these algorithms optimize represents a fixed vehicle-class average or the specific vehicle making the trip. Wang and Zhang’s (2021) [3] finding that fuel-system failure dominates heavy-duty engine subsystem failure rates means the vehicle-class average itself carries a documented source of variance the weighting algorithms never see, because that variance never enters the objective function the algorithms are weighting. Demir, Bektaş, and Laporte's (2011) [12] own comparison of emissions models found meaningful divergence in predicted fuel consumption across models built from different engine-characteristic assumptions, for the identical route and load, direct evidence from within the multi-objective literature itself that the input side of the emissions objective carries uncertainty large enough to matter, uncertainty the field has directed toward comparing models.
That distinction, between improving how objectives are weighted and improving what generates the values being weighted, is the reclassification this article's three literature groups jointly support. Snurnikov’s (2025a) [11] own risk-factor table names vehicle condition as a category without encoding it as a function input, and Snurnikov's (2025b) [21] own routing review reports fuel-saving figures, an estimated 5 to 15 percent additional saving from AI-driven rerouting, up to 50 percent from hybrid powertrains, as fixed averages, not per-vehicle quantities; read together, both of Snurnikov's prior reviews reproduce, from the applied-logistics side, the same descriptive treatment of vehicle condition the multi-objective optimization literature reproduces from the algorithmic side, which indicates the gap is a modeling convention shared across the applied and algorithmic halves of this field. Snurnikov’s (2026a) [20] dissolution mechanism is useful here specifically because it turns that convention into a testable proposition: the monograph's engine-bench results associate a specific, measured combustion-efficiency change with a specific, controllable input, the reactor's turbulence-modulated dissolved-gas concentration, which means a route-optimization model could in principle condition its emissions term on that measured value the same way it currently conditions on speed or load.
Even granting that the necessary sensor data and fleet-scale reference distributions already exist, as the instrumentation and telemetry literature reviewed above establishes, folding a combustion-efficiency signal into an operational routing pipeline raises implementation questions the algorithmic literature has not had occasion to address, because it has never treated vehicle condition as a live input. A dispatcher relying on Xie et al.'s (2026) [1] entropy-weighted TOPSIS ranking or Zhang et al.'s (2025) [6] electric-vehicle formulation would need the OBD-II telemetry stream to reach the routing engine with enough latency margin to influence a decision still in progress, a real-time data-pipeline requirement distinct from the batch-processed maintenance records Kharazian et al. (2025) [19] compile for predictive-maintenance purposes rather than live dispatch. Regulatory and insurance audiences raise a second, related question: if two carriers report different CO2 figures for the identical route and load because one feeds a measured efficiency value into its routing model and the other assumes η = 1.00 by default, the resulting numbers are not comparable without a documented standard for what combustion-efficiency measurement protocol produced each one, a standardization problem the emissions-modeling comparison Demir et al. (2011) [12] ran fifteen years ago already anticipated for engine-characteristic assumptions generally and that a condition-aware objective function would inherit in sharper form. Neither concern undermines the case for making combustion efficiency a model input; both indicate that the data problem identified in this article, once solved technically, opens a second, institutional problem in how a condition-aware emissions figure gets verified and compared across operators.
A reviewer sympathetic to the entropy-weighting and NSGA-II literature might object that vehicle-condition variance, however real, is small relative to the route-to-route differences in distance, speed, and gradient that already dominate the objective function, so that refining the weighting scheme still captures most of the achievable improvement even without a condition-aware emissions term. The threshold analysis above answers that objection directly rather than assuming it away: an 86 percent efficiency floor is not an extreme tail scenario reserved for near-failure vehicles, it corresponds to the moderate-wear regime Wang and Zhang (2021) [3] treat as an ordinary point on the degradation curve well short of the severe fault condition, which means the routing error this article identifies is triggered by unremarkable wear rather than by rare mechanical breakdown. A second, related objection, that fleet operators already replace fuel-system components on a maintenance schedule and so the degraded-efficiency scenario is transient by design, does not survive contact with the same reliability data either: a schedule calibrated to average failure rates leaves exactly the tail of vehicles operating below that average, for however long the interval between scheduled services runs, unaccounted for by the routing model's fixed-efficiency assumption.
5. Conclusion
What this synthesis makes explicit is that hazmat route-optimization research has concentrated its recent methodological advances, entropy weighting, improved NSGA-II variants, robust bilevel formulations, on reconciling objective values against each other, while leaving unexamined whether the emissions and risk values entering that reconciliation represent the specific vehicle making the trip or a fixed class average. Engine-reliability evidence showing fuel-system failure as the dominant subsystem failure mode in heavy-duty diesel engines gives that class-average assumption a documented margin of error the weighting literature has never had reason to consider, because the variable that margin depends on has never been a model input.
The specific question left open is whether feeding a measured combustion-efficiency signal, of the kind Snurnikov’s (2026a) [20] dissolution monograph demonstrates and the telemetry infrastructure Kharazian et al. (2025) and Michailidis et al. (2025) [18, 19] document, into an existing multi-objective routing algorithm changes the resulting Pareto-optimal route relative to the fixed-efficiency version of the same model. Snurnikov's (2025a, 2025b) [11, 21] own prior reviews establish that both the risk-factor and the routing-efficiency sides of this field already treat vehicle condition as a description; that treatment is the specific modeling convention that would need to change first, before any algorithm as sophisticated as Xie et al.'s (2026) or Zhang et al.'s (2025) [1, 6] could be tested against a combustion-efficiency-aware version of itself.
A natural next step, beyond the sensitivity analysis presented here, is a pilot study that instruments a small working fleet with the OBD-II combustion-efficiency telemetry Michailidis et al. (2025) [18] describe, logs the resulting efficiency values against the routes an existing entropy-weighted model such as Xie et al.'s (2026) [1] would have selected under the fixed-efficiency assumption, and compares the two sets of choices directly over enough trips to estimate how often the threshold identified above, η* ≈ 0.86 for the corridor tested here, is actually crossed in ordinary fleet operation rather than only in the bench-scale degradation regimes Wang and Zhang (2021) [3] and Snurnikov (2026a) [20] report. Only that comparison, run on operational data rather than the numerical sensitivity experiment reported above, can establish whether the gap identified in this article changes route selection often enough in practice to justify the data-pipeline and standardization work closing it would require.
References
- Xie, Y., Zhang, W., & Hao, X. (2026). Multi-objective route planning for sustainable multimodal hazardous material transportation: An improved NSGA-II approach with entropy-weighted TOPSIS decision making. Systems, 14(4), Article 361.[CrossRef]
- Bektaş, T., & Laporte, G. (2011). The pollution-routing problem. Transportation Research Part B: Methodological, 45(8), 1232-1250.[CrossRef]
- Wang, C., & Zhang, Q. (2021). Reliability analysis of heavy-duty truck diesel engine based on after-sales maintenance data. Journal of Failure Analysis and Prevention, 21(3), 993-1001.[CrossRef]
- Ren, C., Chen, B., Xie, F., Zhao, X., Zhang, J., & Zhou, X. (2022). Understanding hazardous materials transportation accidents based on higher-order network theory. International Journal of Environmental Research and Public Health, 19(20), Article 13337.[CrossRef] [PubMed]
- Zhou, Y., Zhu, D., Du, L., Wei, S., & Zhu, T. (2023). Globalized robust bilevel optimization model for hazmat transport network design considering reliability. Reliability Engineering & System Safety, 229, Article 109484.[CrossRef]
- Zhang, W., Tian, Z., Sun, G., & Chen, M. (2017). Design of a reliable multi-modal multi-commodity model for hazardous materials transportation under uncertainty. European Journal of Operational Research, 260(2), 696-713.
- Song, Y., & Regan, A. C. (2009). A bilevel flow model for hazmat transportation network design. Transportation Research Part C: Emerging Technologies, 17(5), 559-574.[CrossRef]
- Ghaderi, A., & Burdett, R. L. (2019). An integrated location and routing approach for transporting hazardous materials in a bi-modal transportation network. Transportation Research Part E: Logistics and Transportation Review, 127, 49-65.[CrossRef]
- Jia, H., & Li, J. (2024). Optimal design of a hazardous materials transportation network considering uncertainty in accident consequences. Journal of Advanced Transportation, 2024, Article 1850690.[CrossRef]
- Gholamizadeh, K., Rostami, C., Zarei, E., Yazdi, M., & Moslem, S. (2025). Advancing hazardous materials transport safety: Systematic insights on risks, challenges, and research gaps. Journal of Safety Science and Resilience, 7(1), Article 100226.[CrossRef]
- Snurnikov, A. (2025a). Artificial intelligence in hazardous cargo transportation: Risk prediction and route optimization for U.S. highways. International Journal of Scientific Research in Engineering and Management, 9(11).
- Demir, E., Bektaş, T., & Laporte, G. (2011). A comparative analysis of several vehicle emission models for road freight transportation. Transportation Research Part D: Transport and Environment, 16(6), 347-357.[CrossRef]
- Liu, L., Li, J., Zhou, L., Fan, T., & Li, S. (2021). Research on route optimization of hazardous materials transportation considering risk equity. Sustainability, 13(16), Article 9427.[CrossRef]
- Liu, L., Gan, X., Wu, Q., & Sun, Z. (2024). Route optimization of hazardous material (hazmat) transportation with risk equity and time-varying risk. Transportation Research Record, 2678 (8), 901–918.[CrossRef]
- Sun, Y., Li, X., Liang, X., & Zhang, C. (2019). A bi-objective fuzzy credibilistic chance-constrained programming approach for the hazardous materials road-rail multimodal routing problem under uncertainty and sustainability. Sustainability, 11(9), Article 2577.[CrossRef]
- Zhang, Q., Zhang, Z., & Ma, C. (2025). Multi-objective route optimization for electric vehicle hazardous materials transportation in uncertain environments. Scientific Reports, 15, Article 45092.[CrossRef] [PubMed]
- Tomasoni, A. M., Soussi, A., Zero, E., & Sacile, R. (2025). A GIS-based safe system approach for risk assessment in the transportation of dangerous goods: A case study in Italian regions. Systems, 13(7), Article 580.[CrossRef]
- Michailidis, E. T., Panagiotopoulou, A., & Papadakis, A. (2025). A review of OBD-II-based machine learning applications for sustainable, efficient, secure, and safe vehicle driving. Sensors, 25(13), Article 4057.[CrossRef] [PubMed]
- Kharazian, Z., Lindgren, T., Magnusson, S., Steinert, O., & Reyna, O. A. (2025). SCANIA Component X dataset: A real-world multivariate time series dataset for predictive maintenance. Scientific Data, 12 (1), Article 493.[CrossRef] [PubMed]
- Snurnikov, A. (2026a). Dynamic dissolution of combustible gases in liquid fuels. LAMBERT Academic Publishing.
- Snurnikov, A. (2025b). Sustainable road infrastructure: Reducing carbon emissions through smart routing in US logistics. International Journal of Sciences and Innovation Engineering, 2(11).