
Abstract
Fleet management systems increasingly fold a vehicle's predicted mechanical condition into the same decision that assigns it to a delivery, a route, or a shift, treating the health signal as one more input alongside distance and time windows. This article derives the condition under which that practice improves fleet-level outcomes instead of relocating cost from one part of the fleet to another. Two bodies of prior work bear on the question without meeting: optimization research that couples maintenance forecasts with routing decisions treats forecast reliability as fixed, while cost-benefit research on prognostics quantifies how forecast error erodes value only up to the maintenance-scheduling decision. Reading the two together yields a closed-form breakeven inequality linking a diagnostic classifier's recall and false-positive rate to the ratio between a missed-failure cost and a false-exclusion cost, scaled by the fleet's base fault rate. Applied to published component-level classifier performance and to two documented vehicle telemetry regimes, the inequality holds comfortably for every heavy-duty component category under baseline operating costs, producing a positive net benefit at each, but flips sign for a constrained on-board-diagnostic regime once exclusion cost and base fault rate shift toward values realistic for a tightly scheduled light-duty fleet, generating a measured net loss per dispatched vehicle. The result identifies fleet heterogeneity in sensing infrastructure as the variable that determines whether condition-aware dispatch pays for itself.
1. Introduction
A vehicle's diagnostic sensors can now report the probability that a component will fail within a defined horizon, and dispatch software can now read that probability before assigning the vehicle a job. Whether combining the two produces a better outcome than ignoring the probability altogether depends on how often the probability is wrong. Gerdes, Scholz and Galar (2016) [1] found that condition monitoring prevented about 80 percent of unscheduled maintenance delays where the underlying fault was detectable through existing sensors, against about 20 percent where it was not, a gap of sixty percentage points that sensor coverage alone accounts for, independent of which maintenance policy is applied once a signal exists. That finding implies something the routing literature has not absorbed: the value of acting on a health signal is bounded by the accuracy of the signal itself, and accuracy is not constant across a fleet.
Karazhekov (2026b) [2] reports an integrated dispatch architecture in which a fault-probability estimate, produced by classifiers achieving between 89 and 94 percent recall at false-positive rates of 10 to 15 percent depending on the component category, enters the same weighted objective function that governs deadhead distance and regulatory compliance, with a reported 31 percent reduction in unplanned downtime attributed to the coupling. That figure describes what happened at the recall and false-positive rates actually observed; it does not establish where, on the accuracy scale, the same coupling would stop paying for itself, and the architecture's own classification chapter documents that diagnostic access varies by an order of magnitude between vehicle classes, from roughly two hundred standard parameters on light-duty telemetry to over eight thousand on heavy-duty vehicles. Existing operations-research treatments of joint maintenance and routing decisions do not model this dependency, because they specify the failure process directly as a known random variable, leaving the classifier that would generate such a variable in practice, and its measurable, vehicle-class-dependent error rate, outside the model.
The literature has already answered, in principle, whether integrating condition data into dispatch is desirable. What it has not settled is the error rate at which integration stops being desirable in a specific fleet, which requires treating classifier reliability itself as a decision variable, a requirement formalized below as a breakeven condition relating classifier accuracy to the relative cost of the two errors a fleet-scale deployment can make.
2. Literature Review
The technical foundation for coupling maintenance and dispatch decisions rests on a body of operations-research work that treats the probability of failure as a known input to be optimized around, not as a quantity whose own accuracy carries consequences. López-Santana, Akhavan-Tabatabaei, Dieulle, Labadie and Medaglia (2016) [3] established the combined maintenance-and-routing model in its now-standard form, solving a maintenance sub-problem to fix preventive intervals and feeding those intervals into a routing sub-problem that minimizes travel and failure cost jointly, an alternating procedure that converges once the two sub-problems stop revising each other's inputs. Jbili, Chelbi, Radhoui and Kessentini (2018) [4] extended this by embedding a maintenance cost function directly inside a vehicle routing formulation with time windows, sharpening the trade-off between under-maintaining a fleet, which wastes remaining useful life, and over-maintaining it, which increases labor and parts cost unnecessarily. Dahite, Kadrani, Benmansour, Guibadj and Fonlupt (2022) [5] generalized the same coupling into a bi-objective formulation solved through variable neighborhood search, separating travel cost from a maintenance cost defined either as preventive-plus-corrective expenditure or as pure failure cost, a distinction that already shows the field recognizes the choice of cost structure changes the optimal routing plan.
None of these three formulations makes the value of the coupling depend on how well a real classifier distinguishes an about-to-fail vehicle from a healthy one, because each specifies the failure process analytically instead of estimating it from sensor data. Kazemian, Cavdar and Yildirim (2026) [6] close part of that distance by building the maintenance cost function directly from sensor-driven failure predictions instead of an assumed distribution, and they state plainly that vehicle health management models have tended to produce accurate predictions without a mechanism for acting on them operationally, which is the gap their single-vehicle routing formulation is built to close. Karazhekov's (2026b) [2] architecture answers the same gap at fleet scale: a fault-probability estimate generated by a component-level classifier is published as an event that adjusts a vehicle's mechanical-availability term inside a weighted dispatch objective alongside deadhead distance and compliance risk, and the reported 23 percent reduction in aggregate deadhead distance is attributed specifically to this adjustment preventing the assignment of failure-prone vehicles to distant jobs. The theoretical single-vehicle model and the fleet-scale implementation solve genuinely different problems, yet neither treats the classifier's own error rate as a term the optimization should respond to. Both inherit whatever error the upstream classifier produces, with no stated rule for when that error should suppress the coupling instead of activating it.
A separate line of work does make prognostic error a decision-relevant quantity, but stops at the maintenance-scheduling decision. Feldman, Jazouli and Sandborn (2009) [7] built the return-on-investment methodology still used to justify prognostics and health management programs, and their central finding, that the maturity and robustness of the underlying predictive algorithm directly caps the realizable cost avoidance regardless of how the maintenance program around it is structured, is the mechanism this article extends into a routing context. Hölzel and Gollnick (2015) [8] operationalized that mechanism with a fleet-level discrete-event simulation of commercial aircraft maintenance, showing that introducing prognostic error into an otherwise favorable condition-based maintenance program measurably reduces the program's net present value, because false alarms trigger unscheduled component removals that consume useful remaining life without preventing a real failure.
Gerdes, Scholz and Galar's (2016) [1] 80-versus-20-percent finding, already introduced above as this article's anchoring fact, supplies the empirical mechanism underneath Hölzel and Gollnick's simulated result: detectability, not policy sophistication, sets the ceiling on what any condition-based program can recover. Poppe, Boute and Lambrecht (2018) [9] then formalized the internal trade-off these papers gesture toward, modeling a hybrid condition-based policy around two degradation thresholds, a preventive-action threshold and a failure threshold, and deriving the cost structure under which shifting the preventive threshold earlier trades reduced failure risk against increased premature-replacement waste. Prajapati, Bechtel and Ganesan's (2012) [10] survey situates all four results inside the same inherited assumption of the condition-based maintenance literature generally, that the decision being optimized is when to service a single asset. That framing leaves unaddressed which of several available assets should serve a given demand, exactly the assumption that breaks once the same fault-probability estimate is asked to inform a dispatch choice instead of a maintenance calendar, because a maintenance-scheduling decision that arrives one day early costs at most one day of unnecessary caution, while a dispatch decision that wrongly excludes a healthy vehicle from an assignment displaces the deadhead, latency, and compliance costs of whatever vehicle serves the request instead, a class of cost none of these five papers is built to price.
A third cluster of evidence establishes that the recall and false-positive rate available to feed either of the two preceding literatures trace back to data availability in ways that recur across studies, which is what makes vehicle classification analytically relevant here. Lei, Li, Guo, Li, Yan and Lin's (2018) [11] systematic review of machinery health prognostics traces classifier performance across the field back to the data acquisition stage, arguing that no downstream modeling choice, gradient-boosted trees, deep architectures, or otherwise, recovers discriminative signal absent from the underlying sensor stream. Mahale, Kolhar and More (2025a) [12] demonstrate the practical severity of this constraint directly on automotive on-board-diagnostic data, where failure instances made up only 16.3 percent of the dataset they used and where, even after applying synthetic oversampling, cost-sensitive learning, and ensemble correction, performance still varied by technique in ways that trace back to how much genuine signal the OBD-II parameter set contained in the first place.
Their companion review of ninety-four papers (Mahale, Kolhar & More, 2025b) [13] names data quality and integration into operational decision-making as the field's two most persistent open problems, which is the same pairing this article folds into a single problem, since integration cannot be evaluated independently of the data quality feeding it. Kharazian, Lindgren, Magnússon, Steinert and Andersson Reyna (2025) [14] illustrate what richer sensing buys: their released heavy-duty-truck dataset, built from a dense operational telemetry stream instead of OBD-II alone, has become a reference benchmark precisely because that density is unusual, and Dimidov, Jafarnejad and Frank (2026) [15], working directly on that dataset, still report a substantial rate of false positives as an explicit, named limitation of their otherwise competitive classifier, a result that shows even the richest publicly available heavy-duty telemetry does not push false-positive rates to zero. Karazhekov's (2026b) [2] own classification chapter supplies the mechanism connecting this cluster to vehicle fleet composition specifically, documenting that Class 1 through 3 vehicles typically expose on the order of two hundred on-board-diagnostic parameters while Class 6 through 8 vehicles expose several thousand through the heavier-duty diagnostic protocol, a difference in raw feature availability that, read against Lei et al.'s (2018) [11] and Mahale et al.'s (2025a) [12] findings, implies the same fault-detection architecture cannot be expected to reach the same recall and false-positive rate across every vehicle class it serves, even when the routing and dispatch logic wrapped around it is held constant.
The fourth relevant cluster, heterogeneous and dynamic vehicle routing, confirms this last point by omission. Koç, Bektaş, Jabali and Laporte's (2016) [16] thirty-year survey of heterogeneous vehicle routing classifies fleet composition strictly by capacity, fixed cost, and operating cost, never by sensing or diagnostic capability, and Hoff, Andersson, Christiansen, Hasle and Løkketangen's (2010) [17] survey of fleet composition and routing from an industrial-application standpoint likewise treats a vehicle's class as fixed input data. Baldacci, Battarra and Vigo's (2008) [18] heuristic treatment of the heterogeneous fleet problem inherits the same framing.
3. Methods
The dispatch optimization problem considered here evaluates a fleet serving delivery requests over a rolling planning horizon. Each candidate vehicle carries a true latent mechanical state over the assignment window,
with s = 1 denoting an imminent component failure within the horizon and s = 0 denoting normal mechanical health. An upstream diagnostic classifier generates an alert from telemetry feature vectors,
and the classifier's operating characteristics are its recall and its false-positive rate,
together with the fleet's base fault rate,
the unconditional probability that a candidate vehicle sits in the failure state within the horizon.
Two operational failure modes follow directly from these definitions once the classifier's alert is embedded in the assignment decision. A missed failure occurs when a failure-prone vehicle is dispatched because its alert was negative; the vehicle breaks down en route, and the resulting roadside failure cost, denoted , includes towing, emergency recovery, route cancellation, and the reassignment of every trip that depended on that vehicle completing its route. A false exclusion occurs when a mechanically sound vehicle is sidelined because its alert was positive; the trip transfers to the next-available vehicle, and the resulting cost, denoted , reflects the added detour distance, the reduced utilization of the excluded vehicle, and the fulfillment latency the transfer introduces. A false exclusion produces a bounded operational inconvenience, while a missed failure produces an unbounded roadside event, so the two costs are not interchangeable, and the ratio between them, defined below as K, ultimately determines whether coupling the classifier to dispatch helps or harms the fleet.
If dispatch ignores the classifier and assigns vehicles by proximity and schedule alone, the expected failure cost per assignment reduces to the unmitigated roadside risk,
Once dispatch conditions vehicle availability on the alert, the expected cost instead combines both error types weighted by their respective probabilities of occurrence,
Coupling improves fleet-level outcomes exactly when the integrated expectation falls below the unmitigated one,
which reduces to
Rearranged for the false-positive rate a classifier can tolerate before coupling turns harmful, the condition becomes
or, equivalently, as the minimum recall a classifier must reach at a given false-positive rate,
The governing quantity in both forms is the cost-asymmetry ratio
scaled by the fleet's failure odds π/(1−π); every component-level and telemetry-regime result reported below reduces to where that single scaled ratio places a classifier's observed recall and false-positive rate relative to this boundary.
The breakeven condition was evaluated against operating parameters drawn from published operational and telemetry benchmarks. The roadside breakdown cost was set to a baseline of 2,000 USD per incident, within the 1,200-to-2,800 USD range documented for Class 8 heavy-duty breakdowns. The false-exclusion penalty was varied between 25 and 150 USD per event, with 60 USD taken as the nominal baseline, reflecting the incremental deadhead distance and dispatch latency of routing a displaced trip to a replacement vehicle. The base fault rate π was set at 2 to 5 percent per assignment cycle, consistent with reported cyclical failure incidence for actively dispatched commercial fleets. Component-level classifier performance was drawn directly from the six subsystem categories reported for the heavy-duty architecture under review: braking (R = 0.94, FPR = 0.10), engine cooling (R = 0.93, FPR = 0.12), electrical systems (R = 0.92, FPR = 0.11), wheel-end assemblies (R = 0.91, FPR = 0.13), transmission (R = 0.90, FPR = 0.14), and fuel systems (R = 0.89, FPR = 0.15).
Two vehicle telemetry regimes were compared to evaluate how sensing density shifts these operating points. The high-density regime, corresponding to Class 7-8 heavy-duty vehicles with access to over 1,000 telemetry channels, supports the gradient-boosted classifiers above, calibrated between R = 0.89-0.94 and FPR = 0.10-0.15. The constrained regime, corresponding to Class 1-3 light-duty vehicles restricted to approximately 200 on-board-diagnostic parameters, produces classifiers subject to pronounced class imbalance between failure and non-failure records; under this regime recall remains comparable, at roughly 0.80-0.85, but the false-positive rate rises sharply, to a range of 0.25-0.45, because the same imbalance that starves the classifier of positive examples also inflates its false-alarm rate on the far larger negative class.
4. Results
Table 1 evaluates the six heavy-duty subsystem classifiers against the breakeven criterion under baseline costs ( = 2,000 USD, = 60 USD, π = 0.03), reporting for each category the maximum tolerable false-positive rate implied by the rearranged condition above, the operating margin between that ceiling and the classifier's observed false-positive rate, and the resulting net benefit per 1,000 dispatch decisions.
Under these baseline costs, the roadside breakdown cost exceeds the false-exclusion penalty by a factor of
and this asymmetry, combined with a 3 percent base fault rate, places every one of the six heavy-duty categories well inside the breakeven region: even the weakest classifier in the set, the fuel-system category at 89 percent recall and a 15 percent false-positive rate, operates 0.77 below its tolerable ceiling of 0.92. The margin narrows as the base fault rate π falls or as the false-exclusion cost rises under fleet capacity constraints, because the tolerable false-positive rate scales directly with π/(1−π) and inversely with ; a fleet with a lower failure incidence or tighter vehicle availability tolerates a correspondingly lower classifier error rate before the same coupling decision turns from beneficial to harmful.
The constrained on-board-diagnostic regime supplies the case in which that narrowing crosses into net harm. Consider a light-duty fleet operating a tight fulfillment schedule, where the false-exclusion cost rises to 120 USD because a sidelined vehicle is harder to replace on short notice, and the base fault rate falls to π = 0.01 because light-duty components fail less frequently within a single assignment cycle. The breakeven condition with R = 0.85 yields a maximum tolerable false-positive rate of
An OBD-II classifier operating at the empirically observed false-positive rate of 0.22, within the 0.25-to-0.45 range reported above for the constrained regime, violates this ceiling by a wide margin,
and coupling such a classifier to automated dispatch under these parameters produces a net financial loss of 8.93 USD per dispatched vehicle: the aggregate cost of falsely sidelining sound light-duty vehicles exceeds the roadside failure cost the coupling avoids.
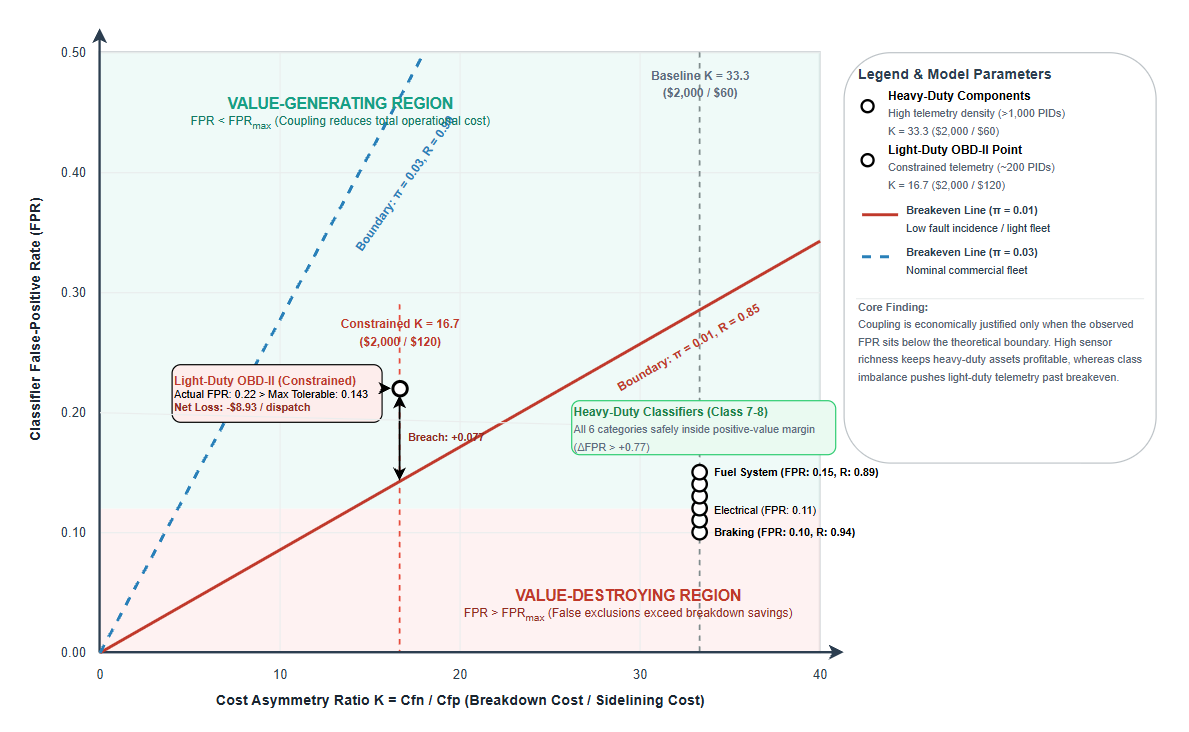
The parametric boundary traced by the breakeven condition across cost-asymmetry ratios and base fault rates separates the operating points where coupling generates value from those where it destroys value. Heavy-duty classifiers, benefiting from the sensing density documented in the telemetry-regime comparison above, sit well inside the value-generating region regardless of which of the six component categories is evaluated. Light-duty classifiers, operating with a quarter of the diagnostic parameters and a correspondingly higher false-positive rate, cross into the value-destroying region once base fault rate and exclusion cost take on values realistic for a tightly scheduled fleet. A single dispatch architecture applied uniformly across both tiers of a mixed fleet therefore generates value at one tier while destroying it at the other, a mechanism a fleet-wide efficiency figure averaged across vehicle classes would obscure, independent of any deficiency in the routing algorithm itself.
5. Discussion
The joint maintenance-routing literature supplies the objective function into which a health signal is inserted; the prognostic cost-benefit literature supplies the logic for pricing that signal's own error; and the sensing-richness literature supplies the reason the error is not a constant but a function of vehicle class. The breakeven condition derived in the Methods section, and evaluated in the Results section against six component-level classifiers and two telemetry regimes, ties these three pieces together into a single decision rule: the classifier's observed recall, false-positive rate, base fault rate, and cost asymmetry jointly determine whether a given fleet sits on the value-generating or value-destroying side of the coupling decision.
Contrary to the framing in Kazemian, Cavdar and Yildirim (2026) [6], who identify the absence of operational integration itself as the central obstacle to realizing value from vehicle health forecasts, the results above indicate that integration without a reliability threshold does not guarantee value even where it is technically implemented. The heavy-duty results in Table 1 show every reported component classifier operating comfortably inside the breakeven region under baseline costs, which is consistent with their argument for integration in that specific regime. The light-duty result complicates it directly: the same integration logic, applied to a classifier operating at a measured 0.22 false-positive rate against a derived ceiling of 0.143, produces a net loss of 8.93 USD per dispatched vehicle. The obstacle their framing locates in missing integration is, at least for this tier of a mixed fleet, better located in a missing decision rule keyed to the classifier's measured reliability at the point of use.
The distinction between missing integration and a missing reliability threshold reframes what Karazhekov's (2026b) [2] reported 31 percent reduction in unplanned downtime is likely to represent. The architecture's classification chapter documents diagnostic access differing by roughly an order of magnitude between light-duty and heavy-duty vehicle classes, and the telemetry-regime comparison in the Results section shows that difference translating directly into a false-positive-rate gap wide enough to flip the sign of the coupling decision for the lighter tier under realistic scheduling pressure. A downtime reduction measured in aggregate across a mixed fleet is consistent with strong positive contributions from the heavy-duty tier, where every classifier sits deep inside the breakeven region, coexisting with a neutral or negative contribution from whatever share of the fleet runs on constrained on-board diagnostics; an aggregate figure cannot distinguish between these two compositions. This connects back to the sixty-percentage-point sensing gap reported by Gerdes, Scholz and Galar (2016) [1] in the Introduction, which described the same mechanism, unequal sensor coverage producing unequal detectability, in a maintenance-scheduling context; the breakeven condition developed here shows that mechanism carries the same weight, and the same sign-flipping consequence, once the decision it feeds shifts from when to service a vehicle to which vehicle to dispatch.
Karazhekov's (2026a) [19] broader framing of transportation fleets as asset-utilization systems is consistent with treating a silent efficiency loss at the light-duty tier as a genuine operational cost with revenue consequences, since a dispatch rule that degrades fulfillment for exactly the vehicles that framing treats as revenue-bearing assets works against its own stated objective. The practical implication is that the same architecture responsible for the reported gains at the heavy-duty tier could, without any change to its routing logic, produce a net loss at the light-duty tier of the same fleet, because the breakeven condition is sensitive to classifier reliability, a quantity the routing algorithm itself does not observe or adjust for.
6. Conclusion
This study establishes a closed-form breakeven condition that resolves an unaddressed tension between maintenance prognostics and fleet dispatch optimization. While operational research models have historically treated component failure probabilities as exogenous stochastic inputs, prognostic cost-benefit frameworks have quantified the penalty of diagnostic error only up to the maintenance planning boundary. Formulating the vehicle assignment trade-off explicitly proves that embedding condition monitoring into dispatch objectives is value-generative only when the recall-weighted risk of roadside breakdown outweighs the false-alarm-weighted cost of sidelining operational equipment. The viability of condition-based dispatch is not an inherent property of optimization sophistication, but an operational threshold determined by the interaction between predictive accuracy, fleet failure incidence, and cost asymmetry.
Applying this analytical threshold to empirical fleet regimes demonstrates that diagnostic benefits do not distribute uniformly across heterogeneous assets. For heavy-duty commercial vehicles equipped with extensive multi-channel telemetry, the resulting classifiers achieve sufficient recall and precision to remain comfortably within the profitable envelope across all major mechanical subsystems. Conversely, light-duty commercial vehicles restricted to standard on-board diagnostics face severe telemetry constraints and class imbalance, driving false-positive rates beyond tolerable limits under tight operational schedules. Applying an identical prognostic dispatch rule across a mixed-tier fleet silently erodes capital efficiency in lighter vehicles, where the cumulative penalty of false exclusions exceeds avoided breakdown expenses.
The primary operational constraint identified by this model lies in the empirical characterization of false-exclusion costs across varying transport topologies. Existing telematics architectures routinely capture roadside recovery expenditures, yet systematic logging of substitute vehicle deadhead detours, delayed customer deliveries, and dispatcher override decisions remains sparse. Establishing dynamic dispatch policies requires tracking dispatcher overrides alongside downstream route variance to replace assumed opportunity penalties with empirical cost distributions.
References
- Gerdes, M., Scholz, D., & Galar, D. (2016). Effects of condition-based maintenance on costs caused by unscheduled maintenance of aircraft. Journal of Quality in Maintenance Engineering, 22(4), 394–417. https://doi.org/10.1108/JQME-12-2015-0062[CrossRef]
- Karazhekov, D. (2026b). Modern mobility systems: Structure, operations, and growth. GlobeEdit.
- López-Santana, E., Akhavan-Tabatabaei, R., Dieulle, L., Labadie, N., & Medaglia, A. L. (2016). On the combined maintenance and routing optimization problem. Reliability Engineering & System Safety, 145, 199–214. https://doi.org/10.1016/j.ress.2015.09.016[CrossRef]
- Jbili, S., Chelbi, A., Radhoui, M., & Kessentini, M. (2018). Integrated strategy of vehicle routing and maintenance. Reliability Engineering & System Safety, 170, 202–214. https://doi.org/10.1016/j.ress.2017.10.024[CrossRef]
- Dahite, L., Kadrani, A., Benmansour, R., Guibadj, R. N., & Fonlupt, C. (2022). Multi-objective model and variable neighborhood search algorithms for the joint maintenance scheduling and workforce routing problem. Mathematics, 10(11), Article 1807. https://doi.org/10.3390/math10111807[CrossRef]
- Kazemian, I., Cavdar, B., & Yildirim, M. (2026). Sensor-driven predictive vehicle maintenance and routing problem with time windows. IISE Transactions. Advance online publication. https://doi.org/10.1080/24725854.2026.2646933[CrossRef]
- Feldman, K., Jazouli, T., & Sandborn, P. A. (2009). A methodology for determining the return on investment associated with prognostics and health management. IEEE Transactions on Reliability, 58(2), 305–316. https://doi.org/10.1109/TR.2009.2020133[CrossRef]
- Hölzel, N., & Gollnick, V. (2015). Cost-benefit analysis of prognostics and condition-based maintenance concepts for commercial aircraft considering prognostic errors. Annual Conference of the PHM Society, 7(1). https://doi.org/10.36001/phmconf.2015.v7i1.2716[CrossRef]
- Poppe, J., Boute, R. N., & Lambrecht, M. R. (2018). A hybrid condition-based maintenance policy for continuously monitored components with two degradation thresholds. European Journal of Operational Research, 268(2), 515–532. https://doi.org/10.1016/j.ejor.2018.01.045[CrossRef]
- Prajapati, A., Bechtel, J., & Ganesan, S. (2012). Condition based maintenance: A survey. Journal of Quality in Maintenance Engineering, 18(4), 384–400. https://doi.org/10.1108/13552511211281552[CrossRef]
- Lei, Y., Li, N., Guo, L., Li, N., Yan, T., & Lin, J. (2018). Machinery health prognostics: A systematic review from data acquisition to RUL prediction. Mechanical Systems and Signal Processing, 104, 799–834. https://doi.org/10.1016/j.ymssp.2017.11.016[CrossRef]
- Mahale, Y., Kolhar, S., & More, A. S. (2025a). Enhancing predictive maintenance in automotive industry: Addressing class imbalance using advanced machine learning techniques. Discover Applied Sciences, 7(4), Article 06827-3. https://doi.org/10.1007/s42452-025-06827-3[CrossRef]
- Mahale, Y., Kolhar, S., & More, A. S. (2025b). A comprehensive review on artificial intelligence driven predictive maintenance in vehicles: Technologies, challenges and future research directions. Discover Applied Sciences, 7(4), Article 06681-3. https://doi.org/10.1007/s42452-025-06681-3[CrossRef]
- Kharazian, Z., Lindgren, T., Magnússon, S., Steinert, O., & Andersson Reyna, O. (2025). SCANIA Component X dataset: A real-world multivariate time series dataset for predictive maintenance. Scientific Data, 12, Article 493. https://doi.org/10.1038/s41597-025-04802-6[CrossRef] [PubMed]
- Dimidov, V., Jafarnejad, S., & Frank, R. (2026). An empirical study on predictive maintenance for Component X in heavy-duty Scania trucks. In Proceedings of the 2026 IEEE International Conference on Prognostics and Health Management (ICPHM). IEEE.[CrossRef]
- Koç, Ç., Bektaş, T., Jabali, O., & Laporte, G. (2016). Thirty years of heterogeneous vehicle routing. European Journal of Operational Research, 249(1), 1–21. https://doi.org/10.1016/j.ejor.2015.07.020[CrossRef]
- Hoff, A., Andersson, H., Christiansen, M., Hasle, G., & Løkketangen, A. (2010). Industrial aspects and literature survey: Fleet composition and routing. Computers & Operations Research, 37(12), 2041–2061. https://doi.org/10.1016/j.cor.2010.03.015[CrossRef]
- Baldacci, R., Battarra, M., & Vigo, D. (2008). Routing a heterogeneous fleet of vehicles. In B. L. Golden, S. Raghavan, & E. A. Wasil (Eds.), The vehicle routing problem: Latest advances and new challenges (pp. 3–27). Springer. https://doi.org/10.1007/978-0-387-77778-8_1[CrossRef]
- Karazhekov, D. (2026a). Asset-based models in modern transportation. Scientia. Technology, Science and Society, 3(6), 1–9. https://doi.org/10.59324/stss.2026.3(6).02[CrossRef]